

Average net income
 €3,382≈ ₺189,058 TRY
 $4,317≈ ₺210,589 TRY

Two countries, different ways of life.
Compare income, living costs excluding rent and purchasing power for the same products.
Netherlands · average monthly net salary€3,382≈ ₺189,058 TRY United States · average monthly net salary$4,317≈ ₺210,589 TRYAverage net income
€3,382≈ ₺189,058 TRY$4,317≈ ₺210,589 TRYLiving costs (excluding rent)
€1,017≈ ₺56,875 TRY$1,191≈ ₺58,118 TRYFamily of four costs (excluding rent)
€3,628≈ ₺202,816 TRY$4,291≈ ₺209,347 TRYPetrol 95 (1 litre)
€2.46≈ ₺137.53 TRY$1.23≈ ₺60.01 TRYApple iPhone 18 Pro 256GB
€1,479≈ ₺82,687 TRY$1,199≈ ₺58,493 TRYBars show each expense as a share of net salary in its own country.
| Expense | Salary share | Netherlands | United States |
|---|---|---|---|
| Living costs (excluding rent) | €1,017.30≈ ₺56,874.90 TRY | $1,191.30≈ ₺58,117.66 TRY | |
| Family of four costs (excluding rent) | €3,627.70≈ ₺202,816.36 TRY | $4,291.20≈ ₺209,346.53 TRY | |
| Petrol 95 (1 litre) | €2.46≈ ₺137.53 TRY | $1.23≈ ₺60.01 TRY | |
| Diesel (1 litre) | €2.45≈ ₺136.97 TRY | $1.66≈ ₺80.98 TRY | |
| LPG (1 litre) | €0.93≈ ₺51.99 TRY | — |
Sourced expenses relative to average net salary; not a quality-of-life score.
Read country averages alongside local housing choices and access to the same product.
Netherlands has 2 recorded cities whose central one-bedroom rents range from €1,677–€2,308; this is neither a national rent average nor a distribution of all listings.
| City | Centre / outside centre | Source date |
|---|---|---|
| Rotterdam | €1,677 / €1,361 | 2026-09-16 |
| Amsterdam | €2,308 / €1,709 | 2026-09-14 |
Do not relabel national salary as pay in these cities. Compare like-sized homes, included utilities and commuting costs; a lower rent may not translate into an equal saving.
United States has 2 recorded cities whose central one-bedroom rents range from $2,589–$4,438; this is neither a national rent average nor a distribution of all listings.
| City | Centre / outside centre | Source date |
|---|---|---|
| Los Angeles | $2,589 / $2,375 | 2026-09-16 |
| New York | $4,438 / $3,033 | 2026-09-19 |
Do not relabel national salary as pay in these cities. Compare like-sized homes, included utilities and commuting costs; a lower rent may not translate into an equal saving.
The comparison below uses same-model records with prices in both countries. Working days do not deduct living costs and are not an actual savings timeline.
| Product | Netherlands | United States | Income-relative assessment |
|---|---|---|---|
| PlayStation 5 Disc | 4.2 working days €649.99 EUR 2026-09-20 | 3.3 working days $649.99 USD 2026-09-20 | United States: 0.9 fewer working days; the same model requires a smaller share of average income. |
| Apple MacBook Air 13-inch M5 / 16 GB / 512 GB | 9.3 working days €1,429.00 EUR 2026-09-20 | 6.6 working days $1,299.00 USD 2026-09-20 | United States: 2.7 fewer working days; the same model requires a smaller share of average income. |
| Apple iPhone 18 Pro 256GB | 9.6 working days €1,479.00 EUR 2026-09-20 | 6.1 working days $1,199.00 USD 2026-09-20 | United States: 3.5 fewer working days; the same model requires a smaller share of average income. |
Salary and living costs are compared in each country’s own currency, so their ratio needs no currency conversion. Population describes scale, not prosperity. City and product records can have different dates; the relevant sources and record dates are shown below.
Explore living costs and purchasing power elsewhere.

 Canada vs Turkey
 Netherlands vs Germany
 Spain vs Turkey
Country data and working time for the same product.
20 September 2026 dataset · Original source dates are preserved. Living costs exclude rent; city rents are not country averages.
Average monthly net salary
€3,382≈ ₺189,058 TRY1 EUR ≈ 55.9077 TRY
Average monthly net salary
$4,317≈ ₺210,589 TRY1 USD ≈ 48.7851 TRY
Equivalents use stored exchange rates, not live bank quotes. Rate dates and sources are in the methodology below.
Salary, rent, living costs and iPhone working days in one card.
Net salary ÷ 22 working days. Assumes all salary is used for the product; expenses are not deducted.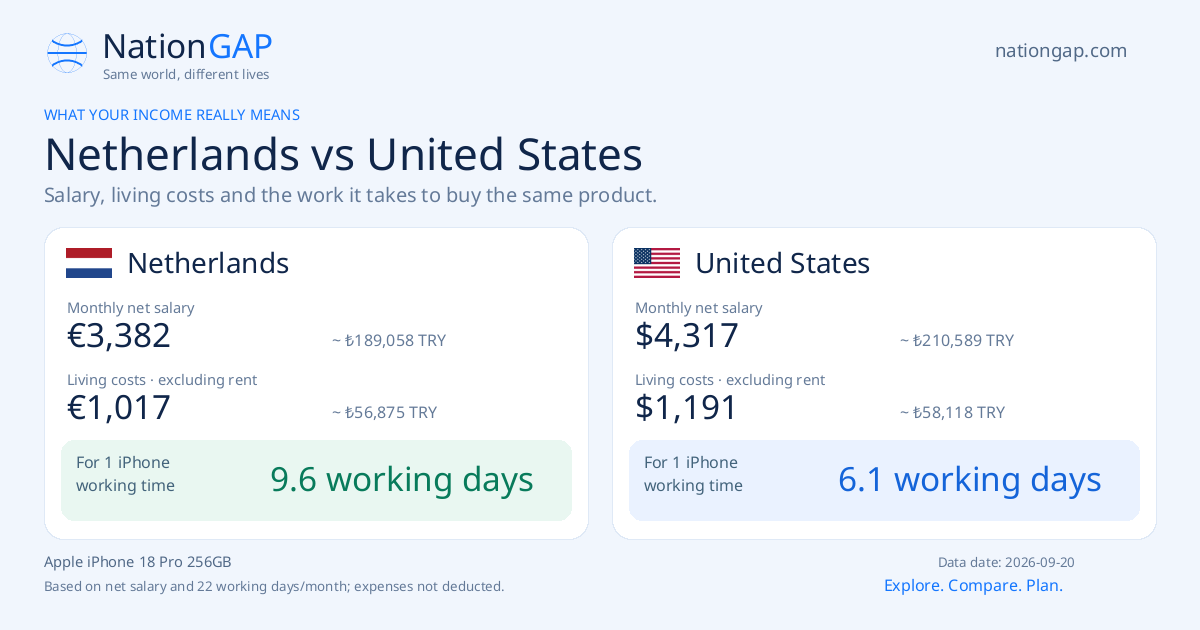 Netherlands€1,017.30≈ ₺56,874.90 TRYSource2026-09-18 United States$1,191.30≈ ₺58,117.66 TRYSource2026-09-20 Netherlands€3,627.70≈ ₺202,816.36 TRYSource2026-09-18 United States$4,291.20≈ ₺209,346.53 TRYSource2026-09-20 Netherlands€2.46≈ ₺137.53 TRYSource2026-09-14 United States$1.23≈ ₺60.01 TRYSource2026-09-14 Netherlands€2.45≈ ₺136.97 TRYSource2026-09-14 United States$1.66≈ ₺80.98 TRYSource2026-09-14 Netherlands€0.93≈ ₺51.99 TRYSource2026-09-14 United StatesNo data
Monthly net salary ÷ 22 working days. Country salary is a benchmark, not personal income.
NetherlandsNo dataNot available United StatesNo dataNot available NetherlandsNo dataNot available United States$36,990.00 USD188.5 working daysBase Model 3 referenceSource Netherlands€649.99 EUR4.2 working daysCurrent official Europe RRPSource United States$649.99 USD3.3 working daysCurrent official RRP; local tax may varySource Netherlands€1,429.00 EUR9.3 working daysVerified currentSource United States$1,299.00 USD6.6 working daysBefore state sales taxSource Netherlands€1,479.00 EUR9.6 working daysVerified currentSource United States$1,199.00 USD6.1 working daysBefore state sales taxSource Netherlands€92.37 EUR0.6 working daysproxySource United States$93.28 USD0.5 working daysproxySource Netherlands€34,940.53 EUR227.3 working daysproxySource United States$25,995.07 USD132.5 working daysproxySource Netherlands€13.01 EUR< 0.1 working daysbenchmarkSource United States$12.39 USD< 0.1 working daysbenchmarkSource Netherlands€4.29 EUR< 0.1 working daysbenchmarkSource United States$4.31 USD< 0.1 working daysbenchmarkSource Netherlands€1.17 EUR< 0.1 working daysbenchmarkSource United States$1.06 USD< 0.1 working daysbenchmarkSourceRotterdam: €1,677
Amsterdam: €2,308
Los Angeles: $2,589
New York: $4,438
Product price ÷ average monthly net salary × monthly working days. Living expenses are not deducted. Currency equivalents use the ratio of existing euro-based rates. Missing rates produce no conversion.
EUR: Rate source · 2026-09-20 14:18:43
USD: Rate source · 2026-09-20 14:18:44
TRY: Rate source · 2026-09-20 14:18:58
More about countries, cities and your next chapter.


Netherlands: costs excluding rent as a share of net salary 30.1%; for one iPhone 9.6 working days. Living costs are not deducted from working time.
United States: costs excluding rent as a share of net salary 27.6%; for one iPhone 6.1 working days. Living costs are not deducted from working time.
Latest source-data date: . Each metric retains its own date and scope.
